User:DarioAndres/CreateUsefulReports: Difference between revisions
DarioAndres (talk | contribs) |
DarioAndres (talk | contribs) |
||
| Line 14: | Line 14: | ||
A more insightful article on how to write good bug descriptions is available [http://www.chiark.greenend.org.uk/~sgtatham/bugs.html at this link], please read that before reporting bugs. | A more insightful article on how to write good bug descriptions is available [http://www.chiark.greenend.org.uk/~sgtatham/bugs.html at this link], please read that before reporting bugs. | ||
====Application specific details==== | |||
Some specific details can be useful to have in bug reports of several applications: | |||
* '''Plasma''': Plasmoids you have in your desktop (both official and unofficial), desktop settings (wallpaper plugin, themes). | |||
* '''Konqueror''': Sites you were visiting, number of opened tabs. | |||
* '''Kopete''': IM protocols you use | |||
* '''KMail''': Mail protocols and account-types that you use | |||
* '''KWrite/Kate/KOffice''': Type of the document you were editing | |||
===Backtraces=== | ===Backtraces=== | ||
Revision as of 15:05, 25 July 2009
Development/Tutorials/Debugging/How to create useful crash reports
Languages: عربي | Asturianu | Català | Česky | Kaszëbsczi | Dansk | Deutsch | English | Esperanto | Español | Eesti | فارسی | Suomi | Français | Galego | Italiano | 日本語 | 한국어 | Norwegian | Polski | Português Brasileiro | Română | Русский | Svenska | Slovenčina | Slovenščina | српски | Türkçe | Tiếng Việt | Українська | 简体中文 | 繁體中文
Introduction
This document describes how to reproduce a useful backtrace of crashing KDE applications. First, some general information is given. Then, we will describe for several distributions how to prepare your KDE packages and gaining the backtrace. This should be enough for most people. There are additional sections on how to create backtraces with the GNU Debugger and with Valgrind, which are in some cases useful.
How to create useful crash reports
A good crash report at Bugzilla consists of two parts: a description of how to reproduce the crash and a backtrace of the crash. With one of those elements missing, it is much harder (if not impossible) for developers to tackle the problem.
Description
A description should consist of more than only "it crashed". Try to describe everything you did prior to the crash. Did you click on a button, opened a particular website or file which caused problems? That little detail which may look useless to you may be useful for the developer, so just write it down.
A more insightful article on how to write good bug descriptions is available at this link, please read that before reporting bugs.
Application specific details
Some specific details can be useful to have in bug reports of several applications:
- Plasma: Plasmoids you have in your desktop (both official and unofficial), desktop settings (wallpaper plugin, themes).
- Konqueror: Sites you were visiting, number of opened tabs.
- Kopete: IM protocols you use
- KMail: Mail protocols and account-types that you use
- KWrite/Kate/KOffice: Type of the document you were editing
Backtraces
Backtraces are essential. They may look meaningless to you, but they might actually contain a wealth of useful information. A backtrace describes which functions were called prior to the crash, so that developers may track down in which function the mess started.
- Don't attach the backtrace to the bug report. Instead, simply paste it. This way it is much easier for developers to search for duplicate reports, because attachments will not be searched.

If you paste a backtrace to a report, make sure you strip all but one or two of the
(no debugging symbols found)
lines from the backtrace as they make it harder to read. (If you are using KDE4.3 or later this is done automatically)
Even though pasting backtraces directly is preferred over adding an attachment, please do not paste other things like logs (valgrind, strace or terminal output) or example data (mails, HTML files and so on). Use attachments for these items.
Having good backtraces has a downside: libraries and executables occupy much more disk space than their optimized counter parts. That's the reason why many distros choose to install stripped files, which results in useless backtraces:
(no debugging symbols found)
Using host libthread_db library "/lib/tls/i686/cmov/libthread_db.so.1".
(no debugging symbols found)
(no debugging symbols found)
(no debugging symbols found)
(no debugging symbols found)
(no debugging symbols found)
(no debugging symbols found)
(no debugging symbols found)
[Thread debugging using libthread_db enabled]
[New Thread -1233848624 (LWP 12212)]
[New Thread -1255081072 (LWP 12820)]
[New Thread -1240921200 (LWP 12819)]
[New Thread -1266680944 (LWP 12818)]
(no debugging symbols found)
(no debugging symbols found)
(no debugging symbols found)
(no debugging symbols found)
(no debugging symbols found)
(no debugging symbols found)
(no debugging symbols found)
(no debugging symbols found)
(no debugging symbols found)
0xffffe410 in __kernel_vsyscall ()
#0  0xffffe410 in __kernel_vsyscall ()
#1  0xb6a1210b in ?? () from /lib/tls/i686/cmov/libpthread.so.0
#2  0xb6a85afe in ?? () from /usr/lib/libX11.so.6
#3  0x00000003 in ?? ()
#4  0x082149c0 in ?? ()
#5  0x00003ffc in ?? ()
#6  0x00000000 in ?? ()
But no worries, with some modifications you can create full blown backtraces for KDE applications.
Preparing your KDE packages
If your distribution has debugging-enabled packages, install them.
It is easy to see which debug packages you are missing from looking at the backtrace. For example, take the following line from a backtrace:
#6 0xb7975bdc in ?? () from /usr/lib/libkmailprivate.so.4
The ?? indicates that the library libkmailprivate.so.4 does not have debug information, which might be available in separate debug packages. In this case, it is pretty easy to guess that you need to install debug packages for KMail to get a better backtrace.
Sometimes, you need to install more than one debug package to get a good backtrace. This depends on how the distribution splits up the packages. For example, for some distributions it is enough to install the debug package for kdepim to get enough debugging information for a crash in KMail, for other distributions there is an additional debug package just for KMail.
Here's a list of how to obtain debug packages for some distributions:
- Debian - Debian offers -dbg packages to easy create useful backtraces. Just install the corresponding -dbg package. e.g. kdepim-dbg for KMail crashes. The dependencies of -dbg makes sure to pull in the other right packages (kdelibs-dbg, gdb, and so on).
- FreeBSD ports - Please refer to the KDE on FreeBSD FAQ.
- Gentoo - Gentoo has its own document describing how to proceed.
- Mandriva - Mandriva 2007.0 and up has additional debugging packages for all of KDE (in fact, for all of its packages). Just install the corresponding -debug package, like kdebase-debug and kdemultimedia-debug. You probably want to install kdelibs-debug anyways.
- Note: the -debug packages are in separate repositories. For instance, for all packages in main, you'll find the debugging package in repository debug_main.
- Kubuntu/Ubuntu - The Ubuntu family makes things quite easy. Every official KDE module has an additional package in the repository, suffixed with -dbg. Always install kdelibs5-dbg, because all KDE applications use kdelibs (kdelibs-dbg for KDE 3 applications). Then you should install a -dbg package for the application which crashed. For example if KOrganizer crashed you should install kdepim-dbg as well. If the program is not from an official KDE module and has no -dbg package, you can install the -dbgsym package from the repository listed on this Debugging Program Crashes page.
- openSUSE - You should only install the -debuginfo packages, for example: kdepimlibs4-debuginfo. You can find these packages in KDE repositories. There is also a dedicated openSUSE debugging page.
- Fedora - Fedora has its own document describing how to proceed. (A debuginfo repository has to be enabled.)
- ArchLinux - If you are using the KDEMod repository you can install the -debug packages for each KDE module. If you are using the standard Arch repositories you need to recompile your packages manually. You will find more help in this article: Debug, Getting Traces
If your distribution doesn't have debugging-enabled packages for KDE, you'll have to compile KDE from sources:
- If you're using KDE 3, then at the configure stage, you should supply the parameter --enable-debug=full in order to build debug symbols in the resulting files.
- If you're using KDE 4, then at the cmake stage, you should supply the parameter -DCMAKE_BUILD_TYPE=debugfull. If you want to specify your own CXXFLAGS, then use -DCMAKE_BUILD_TYPE=None CMAKE_CXX_FLAGS="-O0 -g". You can change the CMAKE_CXX_FLAGS as appropriate for your needs.
Then it's just make and make install as you're used to.
Crash!
Now it's time to crash your application (reproducing the steps that caused the application to crash the first time).
The KDE Crash Handler Dialog should appear right after the crash:
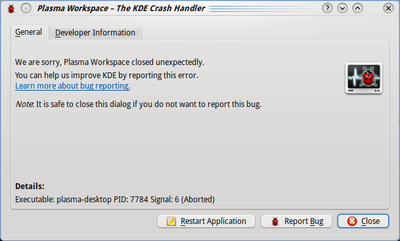
KDE 4.3 and later
Since KDE 4.3 there is a new version of the crash handler dialog:

In order to get a backtrace directly you need to click the "Developer Information" tab.
(you can also use the "Report Bug" function to file a new bug report at the bugtracker site, using an user-friendly interface)
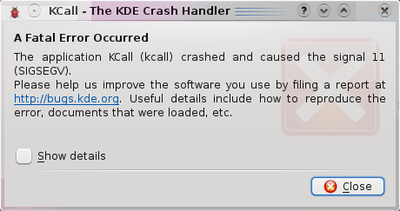
KDE 4.0 - 4.2

In order to get the backtrace you need to click the "Show details" checkbox.
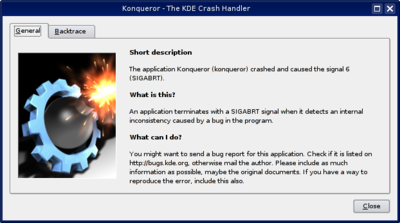
KDE 3.x

In order to get a backtrace you need to click the "Backtrace" tab.
Backtrace Generation
This process may take quite some memory and CPU, so things may go sluggish all of a sudden. But the result should look much better. For example:
Application: Plasma Workspace (plasma-desktop), signal: Segmentation fault
[Current thread is 0 (LWP 3095)]
Thread 2 (Thread 0xa9976b90 (LWP 3096)):
- 0 0xb80ce424 in __kernel_vsyscall ()
- 1 0xb671fc55 in pthread_cond_wait@@GLIBC_2.3.2 () from /lib/libpthread.so.0
- 2 0xb677e73e in QWaitCondition::wait (this=0x9282378, mutex=0x9282374, time=4294967295) at thread/qwaitcondition_unix.cpp:87
- 3 0xb7a707d2 in QHostInfoAgent::run (this=0x9282368) at kernel/qhostinfo.cpp:260
- 4 0xb677db60 in QThreadPrivate::start (arg=0x9282368) at thread/qthread_unix.cpp:189
- 5 0xb671c155 in start_thread () from /lib/libpthread.so.0
- 6 0xb657aa5e in clone () from /lib/libc.so.6
Thread 1 (Thread 0xb5019930 (LWP 3095)):
[KCrash Handler]
- 6 0xa9b82a4e in TaskManager::AbstractGroupingStrategy::closeGroup (this=0x9aed2b0, group=0x9b01d68)
at /home/kde-devel/kde/src/KDE/kdebase/workspace/libs/taskmanager/abstractgroupingstrategy.cpp:142
- 7 0xa9b897d7 in TaskManager::ProgramGroupingStrategy::checkGroup (this=0x9aed2b0) at /home/kde-devel/kde/src/KDE/kdebase/workspace/libs/taskmanager/strategies/programgroupingstrategy.cpp:196
- 8 0xa9b8a47b in TaskManager::ProgramGroupingStrategy::qt_metacall (this=0x9aed2b0, _c=QMetaObject::InvokeMetaMethod, _id=0, _a=0xbf8ea7ac)
at /home/kde-devel/kde/build/KDE/kdebase/workspace/libs/taskmanager/programgroupingstrategy.moc:68
- 9 0xb68834c1 in QMetaObject::activate (sender=0x9b01d68, from_signal_index=<value optimized out>, to_signal_index=22, argv=0xbf8ea7ac) at kernel/qobject.cpp:3066
- 10 0xb6883ad2 in QMetaObject::activate (sender=0x9b01d68, m=0xa9bab194, local_signal_index=1, argv=0xbf8ea7ac) at kernel/qobject.cpp:3143
- 11 0xa9b9d7f3 in TaskManager::TaskGroup::itemRemoved (this=0x9b01d68, _t1=0x9715580) at /home/kde-devel/kde/build/KDE/kdebase/workspace/libs/taskmanager/taskgroup.moc:143
- 12 0xa9b9de40 in TaskManager::TaskGroup::remove (this=0x9b01d68, item=0x9715580) at /home/kde-devel/kde/src/KDE/kdebase/workspace/libs/taskmanager/taskgroup.cpp:174
- 13 0xa9b85120 in TaskManager::GroupManagerPrivate::removeTask (this=0x9063150, task={d = 0xbf8ea83c}) at /home/kde-devel/kde/src/KDE/kdebase/workspace/libs/taskmanager/groupmanager.cpp:289
- 14 0xa9b86dba in TaskManager::GroupManager::qt_metacall (this=0x923eb48, _c=QMetaObject::InvokeMetaMethod, _id=10, _a=0xbf8ea91c)
at /home/kde-devel/kde/build/KDE/kdebase/workspace/libs/taskmanager/groupmanager.moc:99
- 15 0xb68834c1 in QMetaObject::activate (sender=0x912b0b0, from_signal_index=<value optimized out>, to_signal_index=5, argv=0xbf8ea91c) at kernel/qobject.cpp:3066
- 16 0xb6883ad2 in QMetaObject::activate (sender=0x912b0b0, m=0xa9bab35c, local_signal_index=1, argv=0xbf8ea91c) at kernel/qobject.cpp:3143
- 17 0xa9ba1193 in TaskManager::TaskManager::taskRemoved (this=0x912b0b0, _t1={d = 0xbf8ea964}) at /home/kde-devel/kde/build/KDE/kdebase/workspace/libs/taskmanager/taskmanager.moc:159
- 18 0xa9ba28cf in TaskManager::TaskManager::windowRemoved (this=0x912b0b0, w=58735595) at /home/kde-devel/kde/src/KDE/kdebase/workspace/libs/taskmanager/taskmanager.cpp:265
- 19 0xa9ba4734 in TaskManager::TaskManager::qt_metacall (this=0x912b0b0, _c=QMetaObject::InvokeMetaMethod, _id=7, _a=0xbf8eaa8c)
at /home/kde-devel/kde/build/KDE/kdebase/workspace/libs/taskmanager/taskmanager.moc:108
...
This looks better, right? It shows memory addresses, the source files and line numbers and the parameters passed to functions. Which make it more helpful to the developer where to look for the problem.

Retrieving a backtrace with GDB
In some cases, it is not possible to create a backtrace with the KDE Crash Dialog. This may be caused by an application which entered an infinite loop, or the crash dialog did not appear at all for some reason. You can try to grab a backtrace with gdb, the GNU Debugger. GDB is widely available through distribution packages.
Invoking GDB differs from the situation. You can run an application from inside gdb, or attach gdb to an already running process. The latter may be useful when an application already has entered an infinite loop. But we will first start with running an application inside gdb. From the shell, run:
$ gdb someKDEapp
The GDB prompt will appear. Note that this does not start the application itself, you should run it by invoking the run command:
(gdb) run
This will run the application like you are used to, and you can work with it like normal (it only consumes far more memory and may feel sluggish). Now it's time to reproduce your crash. When you succeed, the application just closes and you should return to your GDB prompt. Now it's time to run the 'backtrace' command:

(gdb) thread apply all backtrace
This should give a good backtrace which can be posted at the KDE Bugzilla.
In case you want to attach to an existing process, run the following command in the shell:
$ gdb someKDEapp pid
where pid is the process ID of the process you want to attach to. Once attached, and the process is in an infinite loop, after using the 'backtrace' command again a useful backtrace will appear. You can use 'continue' command to let the application run again and press Ctrl+C in gdb to be able to again enter commands.
Retrieving a backtrace with Valgrind
When it comes to crashes, Valgrind is also a useful tool to create a backtrace. It's not a substitution for GDB, but rather a supplement.
When you run an application in valgrind, every piece of memory read or written by the application is being checked. Valgrind will report erroneous memory operations in the standard output or in a log file. Since most crashes are due to an invalid memory read, valgrind can be useful to track down where the problem occurs.

Like GDB, Valgrind makes running an application much slower, while consuming a lot more resources.
Start the application within valgrind:
$ valgrind --log-file=someKDEapp someKDEapp
Now reproduce the crash. As soon as this happens, the application and valgrind will terminate. What's left is a file named someKDEapp.pid where pid is replaced by the process ID of the valgrind process. The file may list more errors than the one causing the crash. Here's the bit causing the crash which corresponds to the GDB backtrace above:
==23292== Invalid read of size 4
==23292==    at 0x806BD9E: TreeMapItem::parent() const (treemap.h:285)
==23292==    by 0x8065FB9: TreeMapItemList::compareItems(void*, void*) (treemap.cpp:720)
==23292==    by 0x50AC618: QGList::operator==(QGList const&) const (in /usr/qt/3/lib/libqt-mt.so.3.3.8)
==23292==    by 0x806D3BF: QPtrList<TreeMapItem>::operator==(QPtrList<TreeMapItem> const&) const (qptrlist.h:74)
==23292==    by 0x8062DE7: TreeMapWidget::mousePressEvent(QMouseEvent*) (treemap.cpp:1840)
==23292==    by 0x4E2FA62: QWidget::event(QEvent*) (in /usr/qt/3/lib/libqt-mt.so.3.3.8)
==23292==    by 0x4D96CA6: QApplication::internalNotify(QObject*, QEvent*) (in /usr/qt/3/lib/libqt-mt.so.3.3.8)
==23292==    by 0x4D97A87: QApplication::notify(QObject*, QEvent*) (in /usr/qt/3/lib/libqt-mt.so.3.3.8)
==23292==    by 0x4809AC3: KApplication::notify(QObject*, QEvent*) (kapplication.cpp:550)
==23292==    by 0x4D36FD1: QETWidget::translateMouseEvent(_XEvent const*) (in /usr/qt/3/lib/libqt-mt.so.3.3.8)
==23292==    by 0x4D368AF: QApplication::x11ProcessEvent(_XEvent*) (in /usr/qt/3/lib/libqt-mt.so.3.3.8)
==23292==    by 0x4D46760: QEventLoop::processEvents(unsigned) (in /usr/qt/3/lib/libqt-mt.so.3.3.8)
==23292==  Address 0x2C is not stack'd, malloc'd or (recently) free'd
But to be sure, just attach the whole log file to the crash report.
