Marble/MarblePythonLayerInterface: Difference between revisions
Initial port |
updated image and links |
||
| Line 6: | Line 6: | ||
name=Drawing in Custom Layers| | name=Drawing in Custom Layers| | ||
pre=[[Projects/Marble/MarblePythonGeoPainter|Tutorial 13 - Painting onto the map]]| | pre=[[/Projects/Marble/Routing/MarblePythonGeoPainter|Tutorial 13 - Painting onto the map]]| | ||
next=[[Projects/Marble/Runners/MarblePythonPaintingGeoDataLineString|Tutorial 15 - Painting GeoDataLineString: Using the GeoPainter in order to paint a GeoDataLineString object]]| | next=[[Projects/Marble/Runners/MarblePythonPaintingGeoDataLineString|Tutorial 15 - Painting GeoDataLineString: Using the GeoPainter in order to paint a GeoDataLineString object]]| | ||
| Line 115: | Line 115: | ||
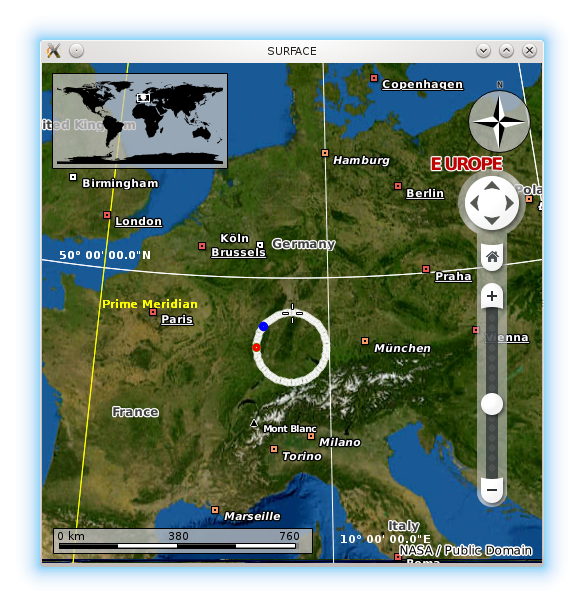
Save the code above as <tt>layers.py</tt> and execute <tt>python layers.py</tt> and you end up with a globe view painting a slightly different interpretation of a world clock: | Save the code above as <tt>layers.py</tt> and execute <tt>python layers.py</tt> and you end up with a globe view painting a slightly different interpretation of a world clock: | ||
[[Image: | [[Image:Marble_painting_layers.png]] | ||
Revision as of 10:55, 30 December 2013
| Tutorial Series | Marble Python Tutorial |
| Previous | Tutorial 13 - Painting onto the map |
| What's Next | Tutorial 15 - Painting GeoDataLineString: Using the GeoPainter in order to paint a GeoDataLineString object |
| Further Reading | n/a |
The previous tutorial showed how to override the customPaint() method in MarbleWidget to paint on top of the map. It is also possible to paint at different layer positions. This is similar to providing a z-order of elements being painted.
To achieve this, we'll take a look at an example. Instead of deriving from MarbleWidget, we create our own Marble.LayerInterface class. After passing it to Marble, it will be included in painting similar to how customPaint() was called. This time however we are able to specify at which layer to paint.
To illustrate the painting in different layers, the code below paints a clock and implements the ability to dynamically switch its layer position by pressing '+'. Notice how the current layer position is indicated in the window title. When painting in the "STARS" layer, you won't see anything -- we'll paint behind the map. In the "SURFACE" layer, city names and other placemarks will be painted on top of us. In contrast, "ORBIT" will make us paint over placemarks, while float items (info boxes) still paint above us. This will change when we paint in the "USER TOOLS" layer.
#!/usr/bin/env python
from PyQt4.QtCore import *
from PyQt4.QtGui import *
from PyKDE4.marble import *
import sys
from math import *

class MyEventFilter(QObject):
    def __init__(self, painter, marble):
        QObject.__init__(self)
        self.painter = painter
        self.marble = marble

    def eventFilter(self, obj, event):
        if(event.type() == QEvent.KeyPress):
            if(event.key() == Qt.Key_Plus):
                self.painter.m_index += 1
                self.marble.update()
                return True
        return False

class MyPaintLayer(Marble.LayerInterface, QObject):
    def __init__(self, marble):
        QObject.__init__(self)
        self.marble = marble
        self.m_index = 0

    def renderPosition(self):
        layers = ['SURFACE', 'HOVERS_ABOVE_SURFACE', 'ORBIT', 'USER_TOOLS', 'STARS']
        index = self.m_index % len(layers)
        tmpList = [layers[index]]
        return tmpList

    def approximate(self, base, angle, dist):
        deg = Marble.GeoDataCoordinates.Degree
        return Marble.GeoDataCoordinates(
            base.longitude(deg) + 1.5 * dist * sin(angle),
            base.latitude(deg) + dist * cos(angle), 0.0, deg)

    def render(self, painter, viewPort, renderPos, layer):
        # have window title reflect the current paint layer
        self.marble.setWindowTitle(self.renderPosition()[0])
        home = Marble.GeoDataCoordinates(8.4, 48.0, 0.0, Marble.GeoDataCoordinates.Degree)
        now = QTime.currentTime()
        painter.setRenderHint(QPainter.Antialiasing, True)

        # large circle built by 60 small circles
        painter.setPen(QPen(QBrush(QColor.fromRgb(255,255,255,200)), 3.0, Qt.SolidLine, Qt.RoundCap))
        i=0
        while(i<60):
            painter.drawEllipse(self.approximate(home, pi * i / 30.0, 1.0), 5, 5)
            i += 1
        # hour, minute, second hand
        painter.setPen(QPen(QBrush(Qt.blue), 4.5, Qt.SolidLine, Qt.RoundCap))
        painter.drawEllipse(self.approximate(home, pi * now.minute() / 30.0, 1.0), 5, 5)
        painter.setPen(QPen(QBrush(Qt.green), 4.0, Qt.SolidLine, Qt.RoundCap))
        painter.drawEllipse(self.approximate(home, pi * now.hour() / 6.0, 1.0), 5, 5)
        painter.setPen(QPen(QBrush(Qt.red), 3.5, Qt.SolidLine, Qt.RoundCap ))
        painter.drawEllipse(self.approximate(home, pi * now.second() / 30.0, 1.0), 5, 5)

        return True;

def main():
    app = QApplication(sys.argv)

    # create the marble widget
    marble = Marble.MarbleWidget()

    # resize the widget and add a window title
    marble.resize(500, 500)

    layer = MyPaintLayer(marble)
    marble.addLayer(layer)
    eventFilter = MyEventFilter(layer, marble)
    marble.installEventFilter(eventFilter)

    # Load the OpenStreetMap map
    marble.setMapThemeId("earth/bluemarble/bluemarble.dgml")
    marble.centerOn(Marble.GeoDataCoordinates(8.4, 49.0, 0.0, Marble.GeoDataCoordinates.Degree))

    # show the marble widget
    marble.show()

    # Update each second to give the clock second resolution
    seconds = QTimer()
    seconds.setInterval(1000)
    app.connect(seconds, SIGNAL('timeout()'), marble.update)
    seconds.start()

    # run the app
    app.exec_()

main()
Save the code above as layers.py and execute python layers.py and you end up with a globe view painting a slightly different interpretation of a world clock:

