Marble/Runners/PaintingGeoDataLineString: Difference between revisions
CezarMocan (talk | contribs) No edit summary |
CezarMocan (talk | contribs) No edit summary |
||
| Line 92: | Line 92: | ||
If things go fine, execute <tt>./my_marble</tt> and you end up with a globe view similar to this: | If things go fine, execute <tt>./my_marble</tt> and you end up with a globe view similar to this: | ||
[[Image:GeoDataLineStringTutorial_p2. | [[Image:GeoDataLineStringTutorial_p2.jpg]] | ||
As you can see, the blue line corresponds to the straight-no-tessellation way of visualization, the red one follows the great circles, and the green one sticks to the latitude circles, since the two endpoints have the same latitude. | As you can see, the blue line corresponds to the straight-no-tessellation way of visualization, the red one follows the great circles, and the green one sticks to the latitude circles, since the two endpoints have the same latitude. | ||
Revision as of 15:20, 24 May 2012
Editing Projects/Marble/PaintingGeoDataLineString
Languages: عربي | Asturianu | Català | Česky | Kaszëbsczi | Dansk | Deutsch | English | Esperanto | Español | Eesti | فارسی | Suomi | Français | Galego | Italiano | 日本語 | 한국어 | Norwegian | Polski | Português Brasileiro | Română | Русский | Svenska | Slovenčina | Slovenščina | српски | Türkçe | Tiếng Việt | Українська | 简体中文 | 繁體中文
| Tutorial Series | Marble C++ Tutorial |
| Previous | Tutorial 9 - Opening .kml, .gpx, ... files |
| What's Next | Tutorial 11 - Displaying GeoDataPlacemark objects without using GeoPainter |
| Further Reading | n/a |
The previous tutorial proved how GeoPainter can be used in order to paint shapes and text at different coordinates of the map (through a GeoDataCoordinates parameter) in a MarbleWidget. Now, we'll show a new way of adding extra content to the globe: by painting GeoDataLineString's using our GeoPainter.
Briefly, GeoDataLineString is a tool class which implements LineStrings (also referred to as "polylines"), allowing us to store a contiguous set of line segments. As you will see in the example, it consists of several nodes (GeoDataCoordinates points), which are connected through line segments.
GeoDataLineString allows LineStrings to be tessellated in order to make them follow the terrain and the curvature of the Earth. The tessellation options allow different ways of visualization:
- Not tessellated, connects each two nodes directly
- A tessellated line, each segment is bent such that the LineString follows the curvature of the Earth and its terrain. A tessellated line segment connects each two nodes at the shortest possible distance ("along great circles").
- A tessellated line which follows latitude circles whenever possible: in this case latitude circles are followed as soon as two subsequent nodes have exactly the same amount of latitude. In all other places the line segments follow great circles.
#include <QtGui/QApplication>
#include <marble/MarbleWidget.h>
#include <marble/GeoPainter.h>
#include <marble/GeoDataLineString.h>

using namespace Marble;

class MyMarbleWidget : public MarbleWidget
{
	public:
	virtual void customPaint(GeoPainter* painter);
};

void MyMarbleWidget::customPaint(GeoPainter* painter) {
	GeoDataCoordinates France( 2.2, 48.52, 0.0, GeoDataCoordinates::Degree );
	GeoDataCoordinates Canada( -77.02, 48.52, 0.0, GeoDataCoordinates::Degree );

	//A line from France to Canada without tessellation

	GeoDataLineString shapeNoTessellation( NoTessellation );
	shapeNoTessellation << France << Canada;

	painter->setPen( oxygenSkyBlue4 );
	painter->drawPolyline( shapeNoTessellation );

	//The same line, but with tessellation

	GeoDataLineString shapeTessellate( Tessellate );
	shapeTessellate << France << Canada;

	painter->setPen( oxygenBrickRed4 );
	painter->drawPolyline( shapeTessellate );

	//Now following the latitude circles

	GeoDataLineString shapeLatitudeCircle( RespectLatitudeCircle | Tessellate );
	shapeLatitudeCircle << France << Canada;

	painter->setPen( oxygenForestGreen4 );
	painter->drawPolyline( shapeLatitudeCircle );
}

int main(int argc, char** argv) {

	QApplication app(argc,argv);

	// Create a Marble QWidget without a parent
	MarbleWidget *mapWidget = new MyMarbleWidget();

	// Load the OpenStreetMap map
	mapWidget->setMapThemeId("earth/openstreetmap/openstreetmap.dgml");

	mapWidget->show();

	return app.exec();
}
Save the code above as my_marble.cpp and compile it:
g++ -I /usr/include/qt4/ -o my_marble my_marble.cpp -lmarblewidget -lQtGui
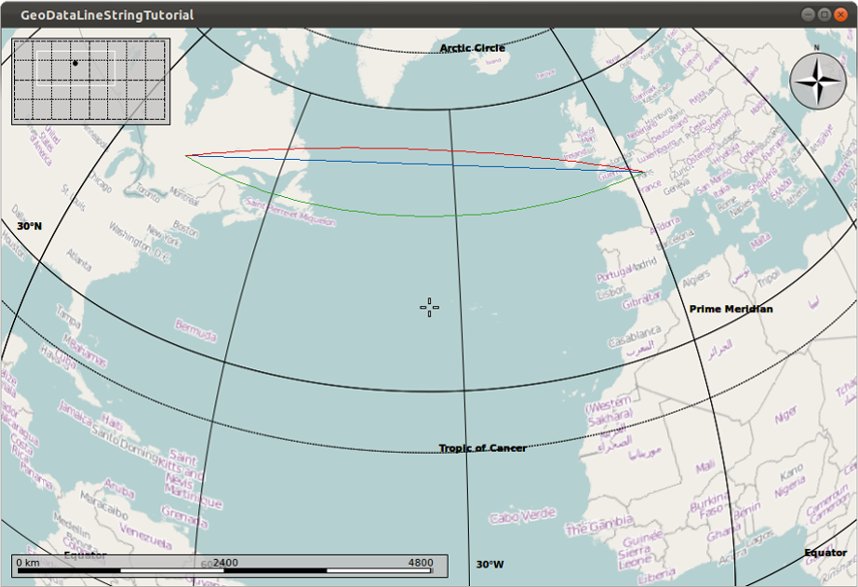
If things go fine, execute ./my_marble and you end up with a globe view similar to this:
As you can see, the blue line corresponds to the straight-no-tessellation way of visualization, the red one follows the great circles, and the green one sticks to the latitude circles, since the two endpoints have the same latitude.

