Development/Tutorials/KPlotWidget
< Development | Tutorials
Introduction and Scope
KPlotWidget is used for easily creating 2-D plots of data sets, complete with plot axes that include labeled tickmarks and optional axis labels. Data sets can be represented as any combination of: discrete points (using a variety of point shapes), connected line segments (using any QPen), or bar-graph rectangles (using any QPen/QBrush). In addition, any data point can have a label string attached to it.
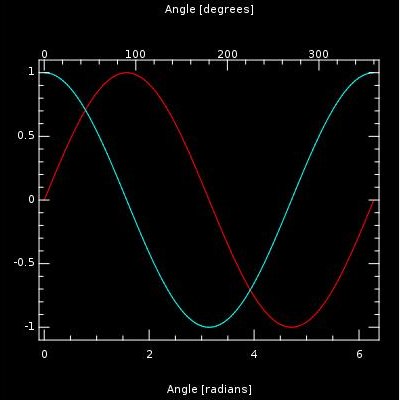
Here is a simple example showing sine and cosine curves:

This example demonstrates most of the commonly-used features of KPlotWidget. It is included in KDE, under kdelibs/kdeui/tests. The first part of this tutorial will explain how to produce this plot using KPlotWidget.
