Projects/KDE on Windows/Tools: Difference between revisions
No edit summary |
|||
| Line 1: | Line 1: | ||
{{Template:I18n/Language Navigation Bar|Projects/KDE on Windows/Tools}} | |||
Required or recommended tools for development and using KDE libraries and applications under MS Windows. | Required or recommended tools for development and using KDE libraries and applications under MS Windows. | ||
Revision as of 13:27, 24 January 2010
Projects/KDE on Windows/Tools
Languages: عربي | Asturianu | Català | Česky | Kaszëbsczi | Dansk | Deutsch | English | Esperanto | Español | Eesti | فارسی | Suomi | Français | Galego | Italiano | 日本語 | 한국어 | Norwegian | Polski | Português Brasileiro | Română | Русский | Svenska | Slovenčina | Slovenščina | српски | Türkçe | Tiếng Việt | Українська | 简体中文 | 繁體中文
Required or recommended tools for development and using KDE libraries and applications under MS Windows.
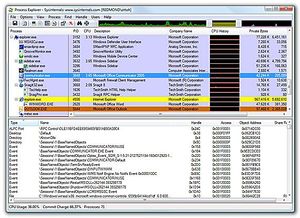
Process Explorer
"Ever wondered which program has a particular file or directory open? Now you can find out. Process Explorer shows you information about which handles and DLLs processes have opened or loaded." (freeware, for all Windows versions) more

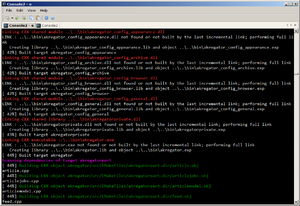
Console 2
"Console is a Windows console window (cmd.exe) enhancement, useful for using when you depend on this shell, e.g. with msvc. Console features include: multiple tabs, text editor-like text selection, different background types, alpha and color-key transparency, configurable font, different window styles." (GPL, for Windows 2000 or newer) more

Debugging Tools for Windows
You can use programs from Debugging Tools for Windows package to debug drivers, applications, and services on systems with Windows NT kernel. (freeware) more
Among others, Debugging Tools for Windows do contain:
WinDbg
WinDbg (windbg.exe), a user-mode and kernel-mode debugger with a graphical interface. It can also be used to debug user-mode crash dumps (postmortem debugging).
Form [1]: "WinDbg provides source-level debugging through a graphical user interface and a text-based interface. WinDbg uses the Microsoft Visual Studio debug symbol formats for source-level debugging. It can access any public function's names and variables exposed by modules that were compiled with Codeview (.pdb) symbol files. WinDbg can view source code, set breakpoints, view variables (including C++ objects), stack traces, and memory. It includes a command window to issue a wide variety of commands not available through the drop-down menus. [..] It also allows you to remotely debug user-mode code.",
To change the postmortem debugger to WinDbg, run windbg -I. (The I must be capitalized.)
Resources related to WinDbg:
- Enabling Postmortem Debugging
- WinDbg. From A to Z! - Theory and examples (56 pages, 580 Kb)
- Common WinDbg Commands (Thematically Grouped)
- Tutorial on solving system crashes using WinDbg
Documentation
- "Debugging Tools for Windows" documentation (debugger.chm) (see online version),
CDB
- CDB (cdb.exe), a user-mode debugger with a console interface,
Logger
Logger (logger.exe and logexts.dll), a tool and a plugin DLL that record the function calls and other actions of a program,
LogViewer
LogViewer (logviewer.exe), a tool that displays the logs created by Logger,
GFlags
- GFlags (Global Flags Editor, gflags.exe), a tool used to control registry keys and other settings
The Breakin tool
- The Breakin tool (breakin.exe), a tool used to cause a user-mode break to occur in a process,
The Kill tool
- The Kill tool (kill.exe), a tool used to terminate a process,
UMDH
- UMDH (User-Mode Dump Heap utility, umdh.exe), a tool used to analyze heap allocations
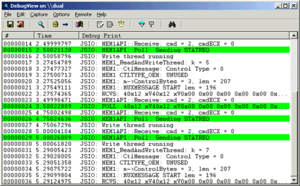
DebugView
Debug messages (logs) generated by kDebug() and kWarning() are not visible on MS Windows unless application is compiled in so-called CONSOLE subsystem. To show these messages also in WINDOWS subsystem, you can use DebugView tool. The tool offers searching in logs, filtering them using wildcards and saving them to file. (freeware) more

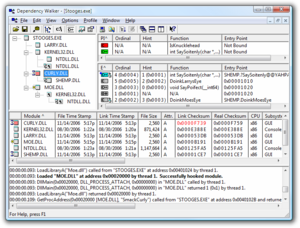
Dependency Walker
A tool for checking dependency of shared libraries. This utility that scans any 32-bit or 64-bit Windows module (exe, dll, ocx, sys, etc.) and builds a hierarchical tree diagram of all dependent modules. (freeware) more

Process Monitor
Process Monitor is an advanced monitoring tool for Windows that shows real-time file system, Registry and process/thread activity. Use it to discover what process is using given files (very useful knowledge since Windows can block these files). more
Handle
Command line program used to find out which program has a particular file or directory open. Handle is a utility that displays information about open handles for any process in the system. more
AutoRuns
AutoRuns provides very comprehensive knowledge of auto-starting locations, shows what programs are configured to run during system bootup or login, and shows the entries in the order Windows processes them. These programs include ones in your startup folder, Run, RunOnce, and other Registry keys. more
