Marble/Runners/MarblePythonDisplayGeoDataPlacemark: Difference between revisions
No edit summary |
No edit summary |
||
| Line 7: | Line 7: | ||
pre=[[Projects/Marble/Runners/MarblePythonLoadingOSM|Tutorial 5 - Loading OSM files into MarbleWidget]]| | pre=[[Projects/Marble/Runners/MarblePythonLoadingOSM|Tutorial 5 - Loading OSM files into MarbleWidget]]| | ||
next=[[Projects/Marble/Runners/MarblePythonVehicleTracking|Tutorial 7 - Vehicle Tracking]]| | |||
}} | }} | ||
Revision as of 18:47, 29 December 2013
| Tutorial Series | Marble Python Tutorial |
| Previous | Tutorial 5 - Loading OSM files into MarbleWidget |
| What's Next | Tutorial 7 - Vehicle Tracking |
| Further Reading | n/a |
In this tutorial we'll show how you can create a nice shiny placemark with an icon and associated geometries (such as LineStrings, LinearRings, Polygons or MultiGeometries). We also cover basic styling of placemarks and geometries.
GeoDataPlacemark is a class which implements the features of KML's Placemark. Basically, it represents an interest point (a simple point or a more complex geometry) on the map, with some information attached.
In order to add a GeoDataPlacemark to our widget, we will use the GeoDataDocument class, which is a container for features (including placemarks) and styles. To make the Document visible, we need to add it to Marble's TreeModel, as shown in the first example below:
#!/usr/bin/env python
from PyQt4.QtCore import *
from PyQt4.QtGui import *
from PyKDE4.marble import *
import sys
import os

def main():
    app = QApplication(sys.argv)

    # create the marble widget
    marble = Marble.MarbleWidget()

    # resize the widget and add a window title
    marble.resize(800, 600)
    marble.setWindowTitle("placemarkTask")

    # load the OpenStreetMap map
    marble.setMapThemeId("earth/plain/plain.dgml")

    # make the map flat
    marble.setProjection(Marble.Mercator)

    # center the document on Europe
    marble.centerOn(Marble.GeoDataCoordinates(15.5, 48.5, 0, Marble.GeoDataCoordinates.Degree));
    marble.setZoom(1400)

    # create a new placemark
    place = Marble.GeoDataPlacemark("Bucharest");
    place.setCoordinate(25.97, 44.43, 0.0, Marble.GeoDataCoordinates.Degree);

    # create a document containing the placemark
    document = Marble.GeoDataDocument();
    document.append(place);

    # add the document to MarbleWidget's tree model
    marble.model().treeModel().addDocument(document);

    # add the widget to the KMainWindow
    marble.show()

    # run the app
    app.exec_()

main()
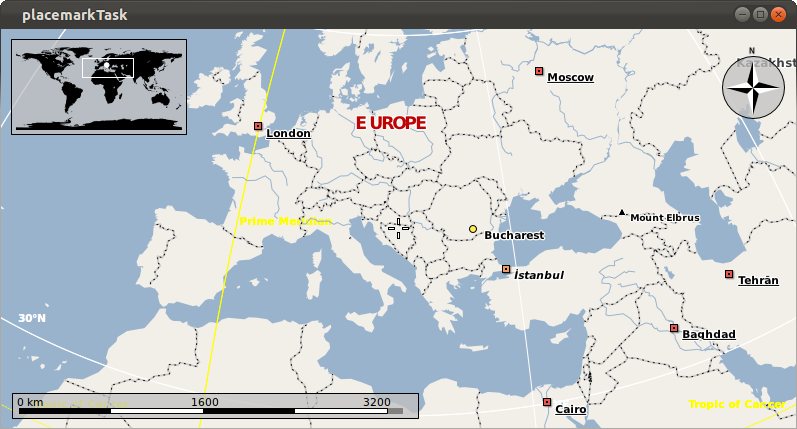
Copy and paste the code above into a text editor and save it as placemark.py. Then run it withpython placemark.py. If things go fine you are going to see the placemark of our newly created Bucharest point.
As we said earlier in this tutorial, it is possible to add more complex geometry to a placemark, meaning objects belonging to GeoDataGeometry or to one of the classes which inherit it.
Styles are another important property of placemarks. They are used in order to customize the appearance of the placemark on the map (e.g. by adding an icon). Geometries such as LineStrings, LinearRings or Polygons can be styled as well: You can change properties such as the pen color, the brush color and the line width.
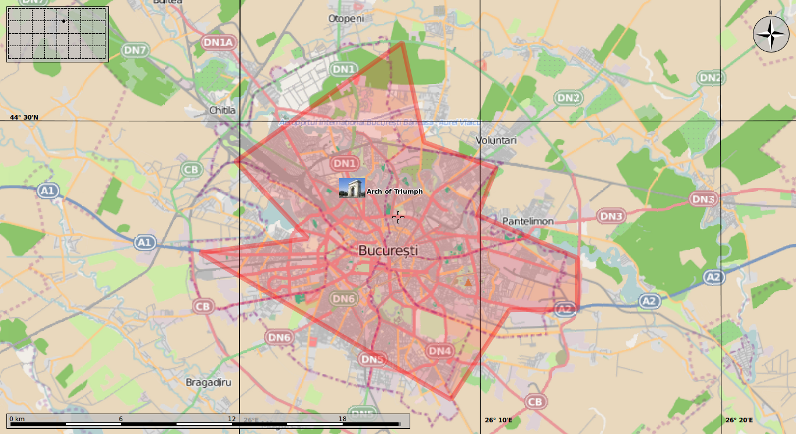
The next example shows how more complex geometry and styles can be added, by creating Bucharest's city boundary, and by adding an interest point (touristic objective) with a photo replacing the regular placemark icon. (in order for the example to work properly you will need to download the icon and place it in the same folder as the source code)
#!/usr/bin/env python
from PyQt4.QtCore import *
from PyQt4.QtGui import *
from PyKDE4.marble import *
import sys
import os

def addPoints(linearRing):
    linearRing.append(Marble.GeoDataCoordinates(25.97226722704463, 44.43497647488007, 0, Marble.GeoDataCoordinates.Degree))
    linearRing.append(Marble.GeoDataCoordinates(26.04711276456992, 44.4420741223712, 0, Marble.GeoDataCoordinates.Degree))
    linearRing.append(Marble.GeoDataCoordinates(25.99712510557899, 44.48015825036597, 0, Marble.GeoDataCoordinates.Degree))
    linearRing.append(Marble.GeoDataCoordinates(26.11268978668501, 44.53902366720936, 0, Marble.GeoDataCoordinates.Degree))
    linearRing.append(Marble.GeoDataCoordinates(26.12777496065434, 44.48972441010599, 0, Marble.GeoDataCoordinates.Degree))
    linearRing.append(Marble.GeoDataCoordinates(26.17769825773425, 44.47685689461117, 0, Marble.GeoDataCoordinates.Degree))
    linearRing.append(Marble.GeoDataCoordinates(26.16489863910029, 44.45366647920105, 0, Marble.GeoDataCoordinates.Degree))
    linearRing.append(Marble.GeoDataCoordinates(26.23394105442375, 44.43247765101769, 0, Marble.GeoDataCoordinates.Degree))
    linearRing.append(Marble.GeoDataCoordinates(26.23388161223319, 44.40720014793351, 0, Marble.GeoDataCoordinates.Degree))
    linearRing.append(Marble.GeoDataCoordinates(26.18689640043445, 44.40683215952335, 0, Marble.GeoDataCoordinates.Degree))
    linearRing.append(Marble.GeoDataCoordinates(26.1462530009004, 44.36252655873379, 0, Marble.GeoDataCoordinates.Degree))
    linearRing.append(Marble.GeoDataCoordinates(25.97226722704463, 44.43497647488007, 0, Marble.GeoDataCoordinates.Degree))

def createStyleBucharest(style):
    lineStyle = Marble.GeoDataLineStyle(QColor( 255, 0, 0, 90 ));
    lineStyle.setWidth (8);

    polyStyle = Marble.GeoDataPolyStyle( QColor( 255, 0, 0, 40 ) );
    polyStyle.setFill(True);

    style.setLineStyle(lineStyle);
    style.setPolyStyle(polyStyle);

def createStyleArch(style):
    iconStyle = Marble.GeoDataIconStyle();
    iconStyle.setIconPath(os.path.abspath("bucharest_small.jpg"));
    style.setIconStyle(iconStyle);

def main():
    app = QApplication(sys.argv)

    # create the marble widget
    marble = Marble.MarbleWidget()

    # resize the widget and add a window title
    marble.resize(800, 600)
    marble.setWindowTitle("placemarkTask")

    # load the OpenStreetMap map
    marble.setMapThemeId("earth/openstreetmap/openstreetmap.dgml")

    # make the map flat
    marble.setProjection(Marble.Mercator)

    # create the Linear Ring (polygon) representing Bucharest's boundaries and include it in a placemark
    Bucharest = Marble.GeoDataLinearRing();
    addPoints(Bucharest);

    placemarkBucharest = Marble.GeoDataPlacemark();
    placemarkBucharest.setGeometry(Bucharest);

    # create the placemark representing the Arch of Triumph
    placemarkArch = Marble.GeoDataPlacemark("Arch of Triumph");
    placemarkArch.setCoordinate(26.0783, 44.4671, 0, Marble.GeoDataCoordinates.Degree);

    # add styles (icons, colors, etc.) to the two placemarks
    styleBucharest = Marble.GeoDataStyle();
    styleArch = Marble.GeoDataStyle();

    createStyleBucharest(styleBucharest);
    placemarkBucharest.setStyle(styleBucharest);

    createStyleArch(styleArch);
    placemarkArch.setStyle(styleArch);

    # create the document and add the two placemarks (the point representing the Arch of Triumph and the polygon with Bucharest's boundaries)
    document = Marble.GeoDataDocument();
    document.append(placemarkBucharest);
    document.append(placemarkArch);

    # add the document to MarbleWidget's tree model
    marble.model().treeModel().addDocument(document);

    # center the map on Bucharest and set the zoom
    marble.centerOn(Marble.GeoDataCoordinates(26.0783, 44.4671, 0, Marble.GeoDataCoordinates.Degree));
    marble.zoomView(2400);

    # add the widget to the KMainWindow
    marble.show()

    # run the app
    app.exec_()

main()
This is the expected outcome after saving and running (like above) is a map of the boundaries of Bucharest:


