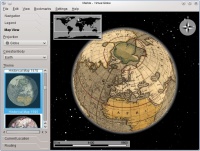
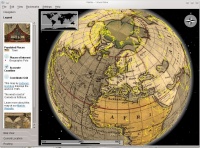
Marble/HistoricalMaps
Historical Maps for Marble
So you want to add a historical map to Marble. This is great since we want to see lots of historical maps in Marble where the user can browse through space and time. There are lots of very early world maps that are under the public domain. You'll find several on Wikipedia.
A pretty comprehensive list of many early world maps is available at:
[| Map List translated via Google Translate]
You can choose a map from these lists (or a different place). The map you choose should
* cover the whole world as it was known at that time (or at least much of it)
* have a resolution that is high enough (ideally starting around 3000x1500 pixel and above).
* have a proper license (Public Domain or CC by SA 3.0 would be alright)
* feature some interesting details that make it stand out against others (that is usually the case).
* be readable (avoid blurry ones).
* be provided in a projection that is easy to reproject
Reprojection is necessary to allow Marble to make use of the map. Generally early world maps are available in the following categories.
- Stereographic Projection (the two hemispheres are displayed as two circles/discs) - This one is pretty straight-forward to reproject (but takes some time nevertheless). [[1]]
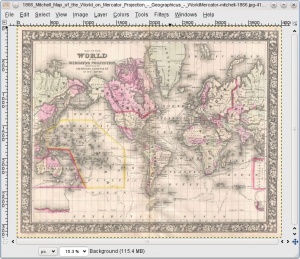
- Mercator Projection - These can be used quite easy "as is" and don't require reprojection. [[2]]
- Other projections - These could be either maps which have no real projection or maps which have a more fancy projection. These maps are usually not very straight-forward to reproject.
If you haven't worked on historical maps, we suggest to start with the stereographically projected maps ("A"):
A. Reprojecting maps provided in Stereographic Projection
Always make sure to back up the results of each step into a separate image file! Always use lossless compression file formats for all operations! This will allow you to later on tweak your map further if required.
Step 1: Download
Download the raw file. As an example we start off with this nice map from Jodocus Hondius made in 1595:
[| World Map from Jodocus Hondius from 1595]
This map has a resolution of 3.281 × 2.343 which gives us good details. It's a pretty early map from the time of discoveries: Inspite of its age the map displays North America's west coast already. But evidently the creator of the map did not have any information about the west coast: he just made it up (and although creatively invented it matches today's outline of North America quite well).
We create a directory "hondius1595" and save our raw file "1595_Vera_Totius_Hondius.jpg" there.
Step 2: Cropping the hemispheres
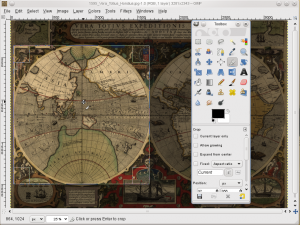
We need to crop the two hemispheres and we need to save them in two different files. You can use Krita, Gimp or Photoshop for that. Make use of the "Crop" tool:
You should crop each circle so that the circular outline of the map is preserved:
Some of the maps have a black-white "dashed" degree scale that serves as a circular outline. It's important that the dashed scale gets included as well! This needs to be the case on the "inner" side as well as on the "outer" side. Here is a different example which has the inner side of the scale bar discontinued but we still crop as if it was still there:
Once you finished cropping you need to scale the hemisphere so that height and width have the same amount of pixels. Otherwise the reprojection tool won't work. In our example after cropping the resulting image had 1605x1625 pixels. You will have a very different value of course. For scaling it's important to use a high quality scaling algorithm: choose Cubic or Lanczos3. After scaling the image up the size is 1625x1625 in our example (which again will be different for your images).
When scaling the second hemisphere we make sure that it has the same size as the first hemisphere.
Save the two hemispheres in two different files. Make sure that you choose "PPM" as a file format!
Now we should have the two PPM files of the two hemispheres in our directory (in our example it's "1595_Vera_Totius_Hondius_east.ppm" and "1595_Vera_Totius_Hondius_west.ppm").
Step 3: Reproject the hemisphere files
If you haven't done so, please download the stereographics conversion tool from here:
File:Stereographic2platecarree lgpl.tar.gz
Create a new directory (e.g. "stereo") and move the tar-ball inside. Inside this directory untar the tarball like this:
tar xvzf Stereographic2platecarree_lgpl.tar.gz
and then start compilation in the konsole inside the directory using:
make
(you can read more about this tool at http://blogs.kde.org/node/4322, but it's not necessary)
For convenience you can copy the resulting stereographic2platecarree executable into the directory that contains your map files (in our example that is the "hondius" directory.
Once you've done that you can invoke the executable like this:
./stereographic2platecarree -i 1595_Vera_Totius_Hondius_east.ppm -o 1595_Vera_Totius_Hondius_east_reprojected.ppm
and the tool will start to do its work:
Importing PPM '1595_Vera_Totius_Hondius_east.ppm'..
Import done.
Converting projection..
Conversion done.
Exporting PPM '1595_Vera_Totius_Hondius_east_reprojected.ppm'..
Export done.
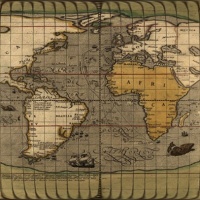
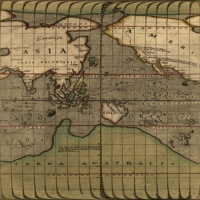
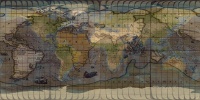
Once you've done the same for the western hemisphere you should have two files which should look about like this:
You are now ready for the next step.
Step 4: Concatenate the two hemispheres
We have two files in equirectangular projection now. One for each hemisphere. We want to concatenate them so that we get a full world map. We can do this by by increasing the canvas width (in Gimp: Image->Canvas Size): we want a canvas size where the width is twice the height. If your canvas height is e.g. 1625 pixels then the width should become 3250 pixels. The original image should align to the left side of the resulting canvas. Now you can copy the full eastern hemisphere and paste it into the enlarged canvas (you might need to create a new layer for that). Be very careful that it properly aligns to the right. Also make sure that the equator, the upper and the lower border align in a pixel perfect way! And make sure that there is no pixel gap in the center or on the right. Better double-check before you proceed!
If the alignment doesn't work out then you might want to carefully scale, move and crop in order to get an acceptible solution. But usually it should do without. Also if the eastern and western hemisphere vary in terms of saturation or color balance you might want to adjust one of the hemispheres accordingly.
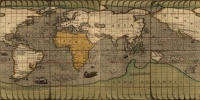
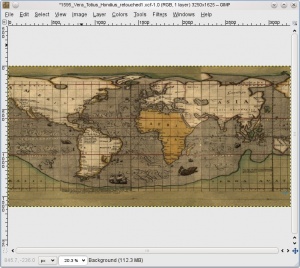
As a result you should have an image like this:
Now flatten both layers (in Gimp: "Image->Flatten Image"). Save the resulting file, make sure you use a lossless format like ppm or png!.
Step5: Normalize the longitude
Now we need to adjust the longitude of our worldmap so that it somewhat matches that of modern maps:
Download
Then resize the map so that the size matches the size of your reprojected world map. Once that is done open your reprojected world map and copy it. Then you go back to the scaled bluemarble.jpg and insert it there as a new layer on top of the satellite image (in Gimp: Edit->Paste as New Layer).
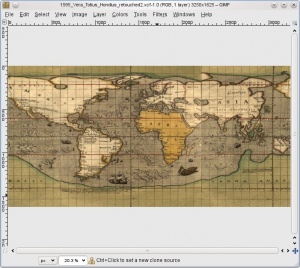
Now open the Layers Dialog (Gimp: Windows->Dockable Dialogs) and adjust the Opacity of the upper layer so that it has 70% Opacity and becomes translucent:
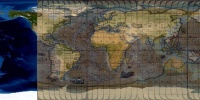
Now you need to move the upper layer so that both maps align at 0° longitude. The definition of the prime meridian has changed throughout the centuries. Therefore we take approximately London (Greenwich) as a reference point. You might also want to take the coastline of Middle Europe and middle Africa into account. The result will look about like this:
Now set the opacity of the top layer back to 100%. You can see that the right part of the map has moved out of the canvas area. We need to cut this part off: You can increase the width of the canvas a bit to get hold of the overhanging part. Then cut and paste the overhanging part into a new layer on the left. The result should look like this:
Delete the layer which still contains the bluemarble.jpg. Flatten the image so that there is just a single layer left. Double check that there are no pixel gaps between the pasted areas and no pixel gaps at the image borders. Save the resulting image into a new file using a lossless file format.
Now it's time for a break: A big amount of work is still ahead. After the break we are ready for the next step.
Step 6: Retouch the resulting map
Now comes the hard part which requires photo retouching skills. This will take a few hours. It might be a good idea to turn some good music on. A graphics tablet might be handy - but it's not necessary: We need to retouch the map. While retouching it's of course important that we still retouch the map in a way that doesn't introduce radical changes. The original spirit of the map should still be preserved.
An important tool for this part of the task is the clone tool. If you are not familiar with it we suggest to look at the docs or at the video tutorial:
http://docs.gimp.org/en/gimp-tool-clone.html
http://www.youtube.com/watch?v=AZKQrqFx2UM
We suggest to use the "Circle Fuzzy" Brush for cloning.
It's also a good idea to make use of layers. On Gimp we suggest to use the .xcf file format from now on. During the retouch phase it's advisable to create "backup files" often so that you can easily return to an earlier state. Use a lossless file format that preserves layers for this.
So here are things that you should look at:
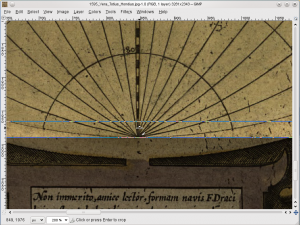
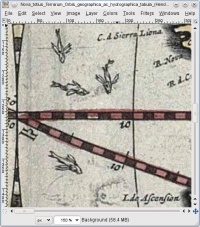
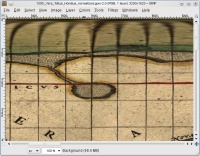
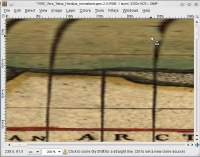
a.) You've probably noticed that at the top and bottom part of the map the longitude lines become thicker and skewed towards the poles.
We need to fix thit in creative ways: Usually this can be done by first using the clone tool to erase the faulty grids
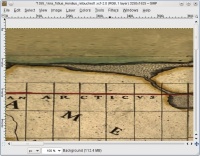
Once we've used the clone tool the result will look like this:
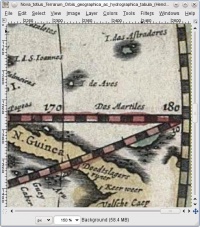
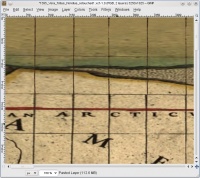
Now we need to restore the missing parts of the longitude lines: We can do this by searching for a "clean" light longitude section that we can easily copy over. You should put the copied part of the longitude line into its own layer. once you've pasted enough line parts into the right positions you can merge all the line-layers into a single layer. You should then use the "Darken" mode on the longitude line layer to "blend" the lines properly into the image: The result will look like this:
Repeat the same procedure with the checkered meridians. The result will look like this:
b.) After our copy/paste operations the grid lines of the original map might not line up completely in all places. Use the Clone tool to adjust the lines so that they come together.
c.) You might also want to repair some text labels, coordinate scales, stains or other severe bugs. But be careful not to overdo it. Don't add or remove islands, cities or other stuff that wasn't there before.
Once you are done with retouching save the resulting map into a new file (using the .xcf format in gimp to preserve layers and quality). Make sure that the map hasn't been moved and make sure that there are no "empty" pixels on the top, left, right and bottom. Keep this file as "the original".
Now we take our new "original" and export the map for usage in Marble:
Finally flatten the image (i.e. merge all the layers) and scale your map up to a width that is the closest upper match of 675 * 2^x. The image in our example has 3250x1625 pixels. So we scale it up to 5400x2700 pixels. Make sure to keep the 2:1 ratio between width and height. Save the resulting image into a separate JPG file with a quality that should be between 85-100% (so good quality and very little lossy compression). The file name should have the original map author of the historical map plus the year in which it was created. All in small caps. In our particular example the file name looks like this:
hondius1595.jpg
Step7: Create a dgml file
Create a new directory in your home directory below ~/.local/share/marble/maps/earth. In our example we do it like this:
mkdir ~/.local/share/marble/maps/earth/hondius1595
The copy the jpg file of the map into it:
cp hondius1595.jpg ~/.local/share/marble/maps/earth/hondius1595
Now take this file:
extract it (by using "gunzip Schagen1689.dgml.gz") and copy it into this new directory:
cp Schagen1689.dgml ~/.local/share/marble/maps/earth/hondius1595/hondius1595.dgml
It's important that the name matches exactly the name of the jpg file - except for the file extension which is ".dgml"!
Now we need a text editor to replace a few strings inside the .dgml file:
1. Line 5: New map name (e.g. "<name>Historical Map 1595</name>")
2. Line 7: New theme identifier (e.g. "<theme>schagen1689</theme>")
3. Line 8: New name for preview icon (e.g. "<icon pixmap="hondius1595-preview.png"/>"
4. Line 15: You need to adjust the description here. You can use HTML tags for formatting.
5. Line 36: Adjust the layer name (e.g. "<layer name="hondius1595" backend="texture">")
6. Line 37: Adjust the texture name ( e.g. "<texture name="hondius1595_data">")
7. Line 38: Replace the source directory name (e.g. "<sourcedir format="JPG"> earth/hondius1595 </sourcedir>")
8. Line 39: Replace the install map value (e.g. "<installmap> hondius1595.jpg </installmap>")
9. Line 177: Replace the legend city pixmap name ( e.g. <icon pixmap="maps/earth/hondius1595/legend/town.png"/> )
10. Line 186: Replace the legend mountain pixmap name ( e.g. <icon pixmap="maps/earth/hondius1595/legend /mountain.png"/>  )
11. Line 195: Replace the legend river pixmap name ( e.g. <icon pixmap="maps/earth/hondius1595/legend/river.png"/> )
12. Line 199: Replace the legend mountain pixmap name ( e.g. <icon pixmap="maps/earth/hondius1595/legend/mountain.png"/> )
At last search for "schagen" in the file to ensure that there are no further occurances that you forgot. Once this is done, save the file.
Step8: Create a preview icon
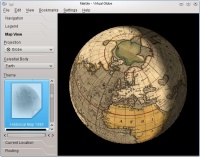
You should now be able to start Marble with your new map: Start Marble and look for your map name inside the Map View tab. Click it and enjoy!
You've probably seen that there's a proper preview icon missing in the Map View tab. We want to change that:
Inside Marble disable the following things:
- stars (in the configuration plugin dialog), atmosphere
- all info boxes (float item, compass, scale bar
- maybe enable the sun shading (ideally switched to the month june)
Now create a screen shot (inside Gimp via File->Create->Screenshot):
We take this screenshot as a source for our preview icon: We download this file
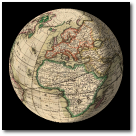
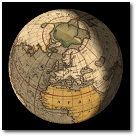
and crop and copy the globe view, resize it so that it fits and insert it into the icon. The result should look about like this:
Notice the drop shadow and the black margin around the actual globe. Again you don't need to create the drop-shadow yourself - you can reuse it from an existing icon!
We copy this icon over to our directory:
cp hondius1595-preview.png ~/.local/share/marble/maps/earth/hondius1595/
And once we restart Marble we'll see our preview icon in action
We are almost done now!
Step9: Create the legend entries
Have a look at the Legend tab. If you look closely and if you compare it with the historical map from schagen then you'll realize that there are still icons missing for the town, mountain, river and lake.
The icons need to be 24x12 in size. Just open your map in your graphics tool and crop and resize some example parts out of it. Create a "legend" subfolder:
mkdir ~/.local/share/marble/maps/earth/hondius1595/legend
and store the icons inside there as "lake.png", "mountain.png", "river.png", "town.png".
If there are no such items then you can also remove the item or even section tags inside the dgml file as an alternative. If you feel that there are items missing then you can of course also add your own ones.
Now it's time for some decoration: Download
This file contains the html code that you can display inside the legend around the actual legend. Extract it and inside this file replace the references to the schagen graphics with your own ones.
Now put the legend html file into your map directory:
cp legend.html ~/.local/share/marble/maps/earth/hondius1595
And save the graphics you want to add into the "legend" subdirectory. The result for our map looks like this after a restart of Marble:
Now our map is done. We just need to package it for deployment:
Step10: Package the historic map
We need to create a tarball of the map for further distribution.
Go into your map directory:
cd ~/.local/share/marble/maps/earth/hondius1595
Then carefully remove all files that were automatically created: Once we execute Marble, Marble creates numbered subdirectories that we don't need for packaging:
rm -r 0 1 2 3
Also our editor might have left a backup file after editing:
rm *~
Now let's step out of our directory
cd ../..
and let's create the final package:
tar cvzf hondius-1595.tar.gz earth/hondius1595/
You can check the files inside via:
tar -tf hondius-1595.tar.gz
In our example this results in the following list:
earth/hondius1595/
earth/hondius1595/hondius1595.jpg
earth/hondius1595/hondius1595-preview.png
earth/hondius1595/legend/
earth/hondius1595/legend/hondius_orig.png
earth/hondius1595/legend/town.png
earth/hondius1595/legend/hondius_title.png
earth/hondius1595/hondius1595.dgml
earth/hondius1595/legend.html
Congratulations! You have now created your own historical map! Please inform [email protected] about the availability of this map.
Other examples for maps of this kind:
B. Reprojecting maps provided in Mercator Projection
Always make sure to back up the results of each step into a separate image file! Always use lossless compression file formats for all operations! This will allow you to later on tweak your map further if required.
Step 1: Download
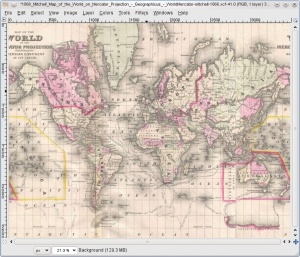
Download the raw file. As an example we start off with this nice map from S. A. Mitchell made in 1866:
[| World Map from S. A. Mitchell from 1866]
This map has a resolution of 4,000 × 3,195 which gives us good details. We create a directory "mitchell1866" and save our raw file "1866_Mitchell_Map_of_the_World_on_Mercator.jpg" there.
Step 2: Align the map horizontally
Make sure that the map is properly horizontally aligned. The latitude lines should always stay exactly horizontally. You can verify this by zooming in. Then either add guard lines or check the y-coordinate of a single latitude line across the whole width of the image. If rotation is necessary use the rotation tool. Do the fine tuning using the rotation dialog which allows to tweak the rotation by fractions of a degree.
Step 3: Cropping the actual map
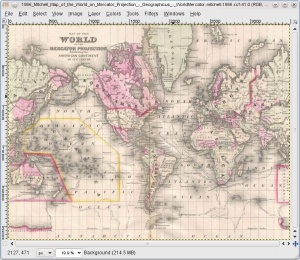
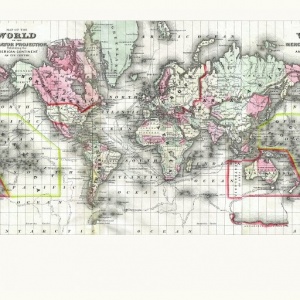
We need to crop the actual map part. You can use Krita, Gimp or Photoshop for that. Make use of the "Crop" tool. Take care of the most upper, lower, left and right border of the image: The upper and lower border should probably not include part of a grid line. The left and right side should be cropped so that both sides moved together result in a single grid line. Here is the map after cropping:
Step4: Normalize the longitude
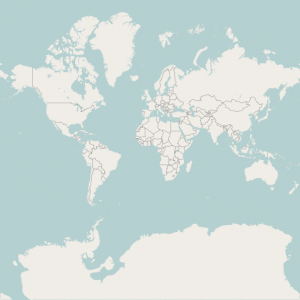
Now we need to adjust the longitude of our worldmap so that it somewhat matches that of modern maps. Have a look at this map:
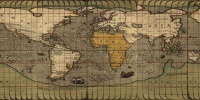
We need to cut off the area that is left to the left border of the upper image. Then we need to move the map so that it aligns to the left canvas border. Afterwards we need to paste the area that was cut off to the right side of the image. The result is an image where the longitude lines match the one above (so that today's 180 deg West is left and 180 deg East is located on the right):
Now we merge the layers we have created so far.
Step 5: Adjust the latitude
Now we save this image and load this mercator map template into gimp:
We check the size of our historical world map. The newly created map needs to have a size that is the upper closest match of values like this: 256, 512, 1024, 2048, 4096, 8192, 16384 (i.e. 256 * 2^x). In our case the historical map has got a width of 4000 pixels, so the closest match is 4096.
We resize the mercator map template so that it resembles a square of the width that we chose above (in our case 4096x4096).
Now we create a new layer in our mercator map template. We copy our historical map and paste it into the newly created layer of our mercator map template.
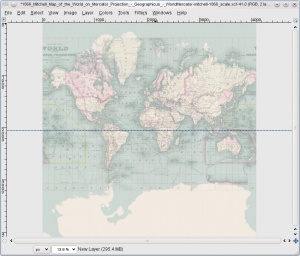
Now open the Layers Dialog (Gimp: Windows->Dockable Dialogs) and adjust the Opacity of the upper layer so that it has 70% Opacity and becomes translucent. We then move and scale the historical map so that its coast lines exactly match those of the mercator map template. You can see that we use a guidance line to properly align the equator:
Once this is done we can remove the mercator map template. We add another layer with the background color white and put it below the historical map layer. We use the color picker and pick the average background color of the historical map (i.e. the ocean color). We fill the white background layer with this ocean color.
Now our map is ready for tile creation. Save it as a jpg with 100% (lossless) compression
Step 6: Tile creation
We copy our jpg file into a new directory. Unlike equirectangular maps our mercator map can't be tiled automatically by Marble itself. So we use the tileimg.sh build script:
We copy it into our new directory, gunzip it and make the script executable by calling
chmod +x tileimg.sh
We then use this script to create the different tile levels. The size of our map is 4096x4096. This equals 256 x 2^4 = 256 * 16 = 4096. So the tile level is "4". We create the tile levels from 0 to 4 by calling our script like this:
./tileimg.sh mitchell.jpg 0 256
./tileimg.sh mitchell.jpg 1 256
./tileimg.sh mitchell.jpg 2 256
./tileimg.sh mitchell.jpg 3 256
./tileimg.sh mitchell.jpg 4 256
As a result we get directories 0 to 4 including subdirectories with the tiles inside.
Step7: Create a dgml file
Create a new directory in your home directory below ~/.local/share/marble/maps/earth. In our example we do it like this:
mkdir ~/.local/share/marble/maps/earth/mitchell1866
Then copy the tile directories and the jpg file of the map into it.
Now take this file:
extract it (by using "gunzip Mitchell1866.dgml.gz") and copy it into this new directory:
cp Mitchell1866.dgml ~/.local/share/marble/maps/earth/mitchell1866/mitchell1866.dgml
It's important that the name matches exactly the name of the jpg file - except for the file extension which is ".dgml"!
Now we need a text editor to replace all the mitchell1866 inside the .dgml file by our own map name. Once this is done, save the file.
Step8: Create a preview icon, a legend and a deployment tarball
Now you need to follow Step 8-10 from Section A.
Finally compare your map with the "Mitchell 1866" one available via GHNS or via Marble's map page.
A last note: Mercator based maps will always look a bit blurry around the equator at low zoom. This is due to undersampling. Therefore we rather suggest to use equirectangular maps as source maps if possible.
C. Reprojecting maps provided in other Projections
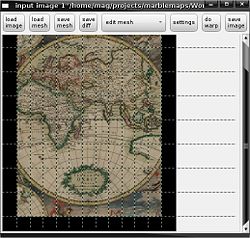
Step 1: Morphing
A generic method to reproject even fancy projections is morphing:
If your map is provided in stereographic projection then you should follow section A instead since the approach shown there is easier and less time-consuming.
Maps for Marble need to get provided in plate carrée projection (also referred to as "Equirectangular projection"):
There are morphing tools that will let you morph ancient maps into the desired projection. It doesn't require too many skills. Just some patience and love to detail.
You can use xmorph/gtkmorph to morph the images. It is a old piece of software, and is not actively maintained anymore. However it is mature enough for what we need. It likely is in your distribution's repository, if not you can get it on sourceforge.
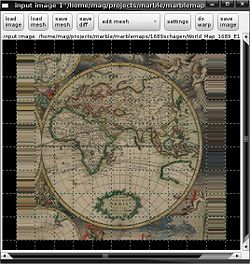
To load the image you want to choose into gtkmorph, click on the "Load image" button on the "input image" window. You can adjust where the mesh's position and the image size, it will be easier if you roughly align the mesh with map before you start. But before you click "Apply", you must change the resolution on the resulting image, to do this you need to change the "width" and "height" on the bottom of the "resulting image" window.
Be careful as gtkmorph has a tendency to crop the images, even if the resulting image is the same resolution as the original!!
By default you there are only a few mesh lines, to get more right-click on the field and choose "add horizontal line" and "add vertical line" - there appears to be a hotkey, but that don't seem to work. You can also set the minimum amount of lines to ~50 by editing the libmorph/morph.c line 48 & 49, but that may be going too .
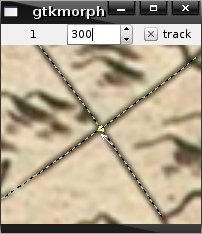
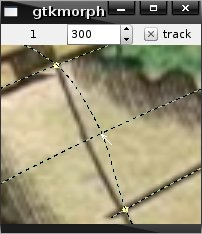
Once you've got it all setup you are gonna start on the more repetitive task, you're gonna need to place the yellow dots so that the grid aligns with the grid on the map.
If you align every second line on the mesh to every line on the map, that will give you some wiggle room if the line between two dots don't really follow the line on the map.
Once you have set all the yellow dots you simply click the 'do warp' button and about a half a minute later you'll hopefully have something like this: Then save the image by clicking on the 'save image' button, the result should be a square map that can be used in Marble. Save the mesh, and export the image, .PPM and .PNG should be a good choice of format.
Step 2
Now that you've successfully morphed the map you need to continue with steps 5.-10. from the stereographic maps section.
Other examples of maps of this kind:
- Universalis cosmographia secundum Ptholomaei traditionem et Americi Vespucii alioru[m]que lustrationes. (General information)
Licensing
If you find new maps it's always important to check the license. Although ancient maps should usually be under the public domain there are several people who claim copyright on the data due to the image manipulation work they have done as a part of post-processing the scan. No matter whether this is legitimate or not we should respect those claims and look for data that was intended to be published under the public domain (or another free license) and use that.
It's important to note that people like to distribute imagery "free for non-commercial usage". Unfortunately we are not able to use and distribute this data as this would e.g. prohibit most Linux Distributors from distributing our software. So do not use data that is "free for non-commercial use"! It's not suitable for our purposes. If you think that there is a chance that the author might agree to change the license to a less restrictive one then it might be worth to contact him. However pretty often the "non-commercial" wording is provided intentionally this way to allow for a business case of the author.

